Recently I took a bunch of data from Handschriftencensus, the online catalogue for Middle High German manuscripts. Handschriftencensus was developed mostly at the University of Marburg, but since 2017, it is part of the Mainzer Akademie der Wissenschaften und der Literatur. They are supposed to have an entry for every extant Middle High German text listing all its witnesses and I don’t even want to imagine what my PhD would have been like without this amazing resource. You deserve a lot of love and respect Handschriftencensus.
What do I want to do with this data? For now, I just want to explore it a little bit with basic text analysis and visualization technologies. Here are some of the things I discovered.
I collected 5917 entries from the database. However, the catalogue is not completely accurate. Many different short texts are registered under only one entry (for example, Stricker: Kleinere Reimpaardichtung is an entry name that could mean any of over 100 different short texts). I might try to improve this database in the future.
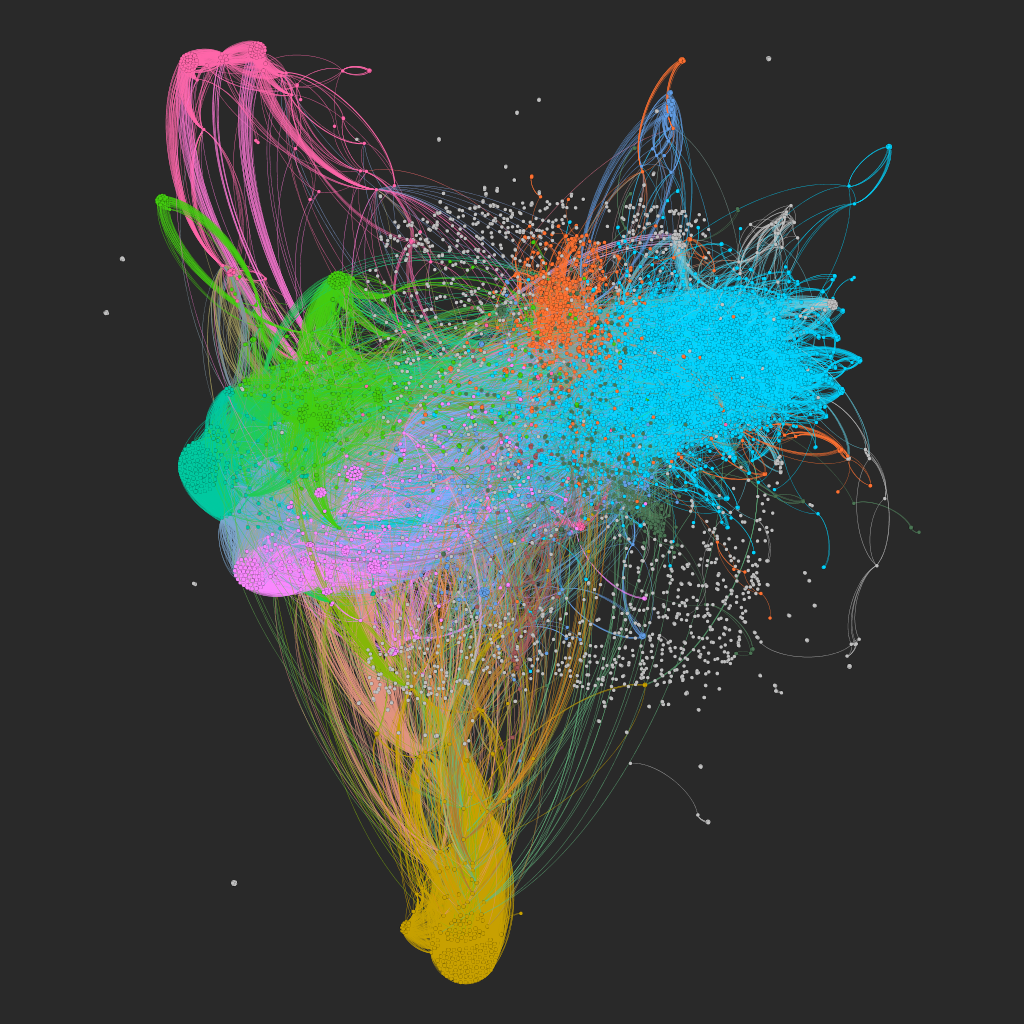
I found out that there are 1075 works I call “islands”: that are never in the same manuscript with other texts. This means that almost 5 out of 6 texts in the corpus are transmitted at least once together with other texts. In other words, the Middle High German book was typically a compilation of different works and not a single volume for a single work. It is possibly to represent this network of interrelated texts as a graph (which I generated with Gephi):

To explore the graph with more detail, open the following link (it might take several seconds to load the whole thing): Detailed Graph
Each node (point) of the graph represents one work according to the Handschriftencensus catalogue. The edges connect works when they share a manuscript. We can see there are some islands and some small isolated blocks of texts, but, for the most part, the network is an interconnected continent. It is almost always possible to create a path between any two nodes.
The colors of the graph were generated by Gephi with the modularity function, which uses a community detection algorithm to highlight the interrelated nodes. My first impressions of this result are:
- Lyric poetry far away in the brown South,
- Some love literature in the far pink north.
- In the main area it is possible to distinguish the blue East (mostly religious literature) and the purple-green West (mostly profane literature).
- The orange contains a lot of Sapiential or Didactic literature.
I am not 100% confident of this interpretation and in many places it is not so easy to figure out what the cluster is about. I will try to improve the corpus and the graph in the future to be able to perform more reliable analysis. I will make the data available too as soon as I can.
Comments
Post a comment
All comments are held for moderation; basic HTML formatting accepted.